
Recent News
DSD and BI: A Winning Combination for Higher Profit Margins
Key Points
- Direct Store Delivery (DSD) combined with Business Intelligence (BI) offers a powerful strategy for optimizing operations and increasing profit margins through real-time data analysis and visualization.
- Crucial profit margin KPIs for DSD businesses include gross profit margin, net profit margin, and average drop size. BI tools enable real-time tracking and analysis of these metrics.
- BI dashboards provide intuitive insights through interactive visualizations, real-time data updates, and customizable layouts.
- Actionable strategies derived from BI insights include optimizing pre-order and delivery routes, adjusting pricing strategies, and enhancing promotional effectiveness based on data-driven decision-making.
The Importance of Profit Margin Insights in DSD
In the world of direct store delivery, the ability to effectively manage profit margins can make the difference between thriving and merely surviving. DSD businesses often face unique challenges, such as fluctuating fuel costs, variable demand, and the need for precise inventory management. By leveraging Business Intelligence (BI) tools, DSD companies can gain deeper insights into their cost structures, identify areas for improvement, and make data-driven decisions that enhance their profit margins.
In this article, we’ll explore some of the most important Key Performance Indicators (KPIs) for measuring profit margins and how BI solutions can help DSD businesses analyze these metrics effectively. We’ll also share some examples to demonstrate how this can quickly be done with our IntegraSys Analytics BI platform.
Identifying KPIs for Profit Margins

Key Performance Indicators (KPIs) are crucial for Direct Store Delivery (DSD) businesses. KPIs allow them to measure and evaluate different aspects of their distribution operations. By focusing on the most relevant KPIs and utilizing Business Intelligence (BI) tools, companies can uncover valuable insights, optimize their profit margins, and make data-driven decisions to enhance overall profitability.
Several KPIs impact profit margins in DSD operations:
- Sales Revenue: Monitoring overall sales revenue helps identify trends and opportunities for growth, which directly impacts profit margins.
- Gross Profit Margin: This fundamental KPI measures the percentage of revenue retained after accounting for the cost of goods sold (COGS). It’s calculated as (Revenue - COGS) / Revenue x 100. Maintaining a healthy gross profit margin is critical for overall profitability. The Revenue figures for ‘Gross Sales’ includes sales and credits issued to both customers and distributors. It does NOT include sales made by the distributor to their end customers.
- Net Profit Margin: This KPI determines the percentage of net income generated from revenues. Calculated as (Net income / Revenue) x 100, it offers a comprehensive view of a company’s profitability after all expenses are considered.
- Average Drop and Delivery Costs: Tracking the costs associated with product delivery, including fuel, labor, and vehicle maintenance, is crucial for optimizing profit margins in DSD operations. The cost to simply stop a truck before selling anything is approximately $120. In general we target a $300 to $400 average drop (invoice to customer) to keep margins healthy.
How BI Tools Can Optimize DSD Profit Margins
Business Intelligence (BI) dashboards are powerful tools that provide visual and intuitive insights into business performance, allowing Direct Store Delivery (DSD) companies to quickly identify profit margin trends and make data-driven decisions. These dashboards offer several advantages:
- Data Visualization: BI tools can create intuitive dashboards that display KPIs in easy-to-understand formats, allowing managers to assess performance at a glance.
- Real-time Monitoring: With BI, companies can track KPIs in real-time, enabling quick responses to emerging trends or issues.
- Predictive Analytics: Advanced BI tools can use historical data to forecast future performance, helping businesses make proactive decisions to optimize profit margins.
- Automated Reporting: BI systems can generate regular reports on KPIs, saving time and ensuring consistent monitoring of critical metrics.
- Data Integration: BI tools can consolidate data from various sources, providing a comprehensive view of the business and enabling more accurate KPI tracking.
By leveraging BI tools to track these KPIs, DSD businesses can gain a deeper understanding of their operations, identify areas for improvement, and make data-driven decisions to optimize their profit margins. This approach enables companies to stay competitive and drive sustainable growth.
A Real DSD Example
Picture your DSD business data as a collection of Lego bricks. Just as you can sort, arrange, and assemble these bricks into a visual model, the right business intelligence solution can help you transform your DSD metrics (data) into a meaningful story for boosting your profit margins.

Our IntegraSys Analytics platform enables distributors to follow this process with their business data. The example below displays a set of primary KPIs computed from a distributor’s business data. These “bigger” metrics provide a comprehensive overview of the business’s profitability performance.
The first step is to set the filters on the left, under “Executive Review,” to examine the KPIs for a time period (e.g., Q1 2024):
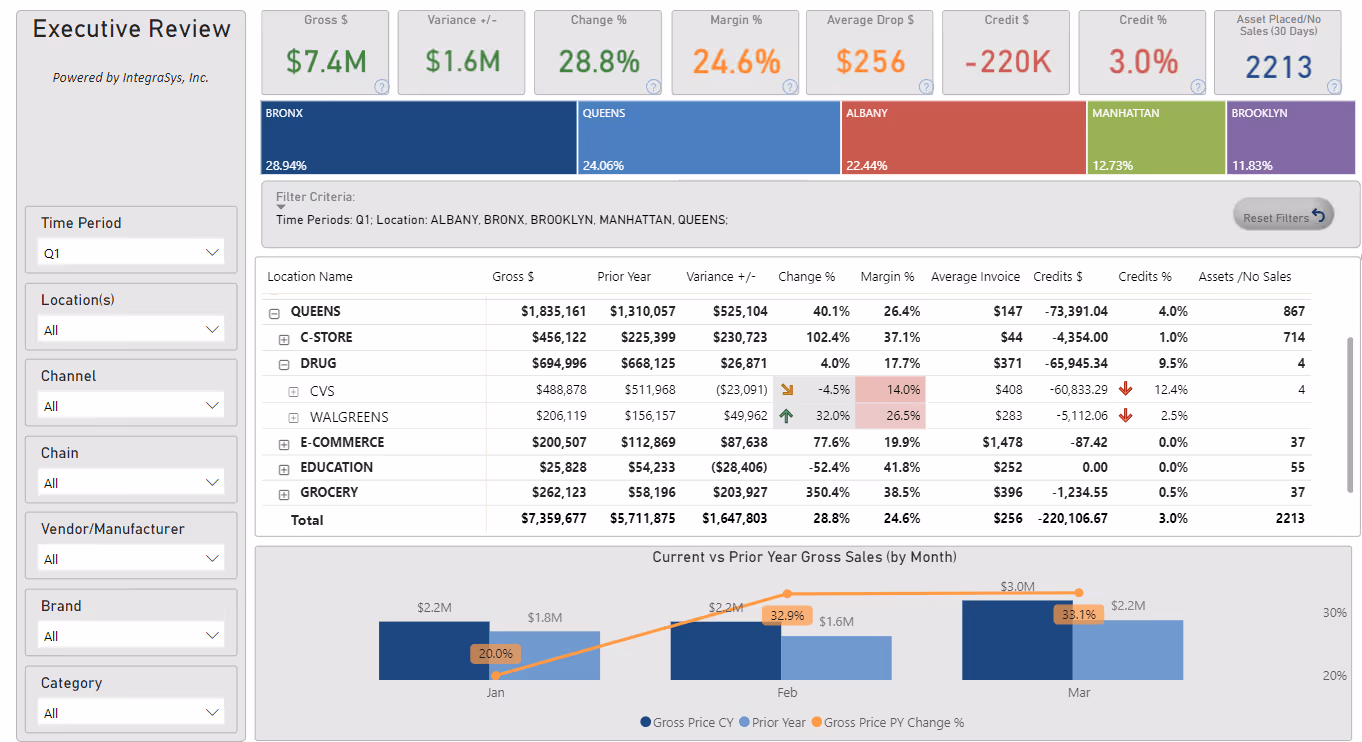
Based on these filters, the KPIs illuminate the current trends in this distributor’s business.

These high-level sales KPIs can be quickly drilled into for deeper insights. For example, if you notice that your average drop dollar amount is below $300, you can quickly correct this by setting order minimums which will require every invoice to be a minimum of $300.
In the screenshot below, the viewer can monitor and quickly gain insight into Route Profitability and Margin for a specific chain in the past 30 days.

Note: This data is exportable to Excel for additional analysis/reporting.
By leveraging IntegraSys Analytics, your DSD business can move beyond surface-level metrics. Our BI tool can help you build a detailed model of your operations, piece by piece, providing the clarity needed to make informed, data-driven decisions. With these insights, you can increase your profit margins and ensure your business runs smoothly.
Conclusion
Business Intelligence (BI) tools offer powerful capabilities for Direct Store Delivery (DSD) companies to optimize their operations and enhance profit margins. The combination of DSD and BI creates a powerful synergy that allows businesses to monitor and improve their profit margins continuously. With access to real-time data and analytics, companies can quickly identify areas where costs can be reduced, and revenue can be increased, leading to higher overall profitability.
To learn more about how IntegraSys Analytics can benefit your business, request a free BI demo today and start transforming your data into actionable, profit-driven insights.
Streamline Your DSD
.png)


.avif)
All Rights Reserved.